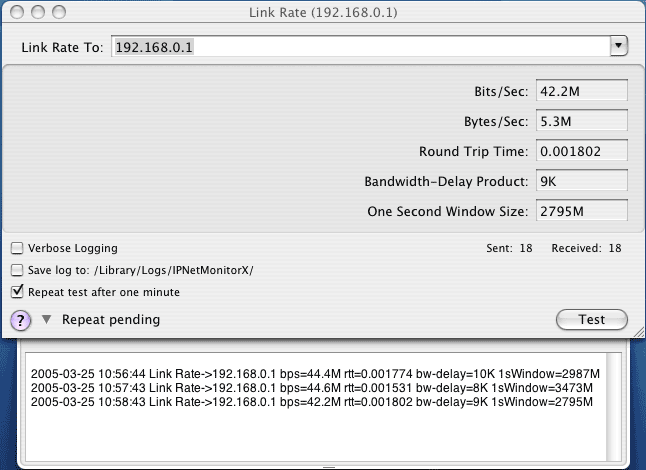

The Link Rate tool estimates the available bandwidth or transfer rate of a data link by sending a series of ICMP echo requests (pings) and comparing the relative time it takes for each response to arrive. For example, if we send two pings of 1000 bytes one immediately after the other and measure the arrival time of each response, we can estimate that the arrival time of the second ping compared to the first one reflects the ammount of time it takes to send or receive an additional 1000 bytes. The Link Rate tool computes the available bandwidth based on the measured time to transfer these bytes.
Notice the round trip time can fluctuate due to variations in network load (available bandwidth) and the responsiveness of the target, so this is only an estimate. By choosing the target carefully and comparing a few estimates, we can usually get a good idea of the effective link rate. When measuring slower links such as a dial-up analog modem, ISDN, or even DSL, other fluctuations tend to be small compared to the data transfer time.
For asymetric data links that are faster in one direction than the other (56K modem or ADSL for example), the Link Rate tool estimates the slower direction since that is what limits how fast we can send or receive one packet after another. To measure the upstream and downstream rates separately, you will need a tool that can measure both ends of the network link. Some websites provide Java tools for this purpose including this one: <http://myspeed.visualware.com/speedtest/speedtestjs.html>
If traffic is split accross more than one data link (connection teaming for example), this can generate unexpected results. The Link Rate tool ignores responses that arrive out of order.
Generally you can find the first router on the other side of your Internet connection (dialup, cable modem, or DSL) using the TraceRoute tool and use this as the target (select the corresponding row in the TraceRoute tool and then open a Link Rate window). By measuring the rate over this single link, you can minimize the effects of competing network traffic from the rest of the Internet. As a convenience, the router address for each configured interface and name server addresses are listed in the target popup. The name server address is often a good approximation of the other side of your ISP link.
You can use the Link Rate tool to measure the current connection rate of your modem, DSL line, or even AirPort wireless (which varies depending on radio conditions).
In addition to measuring the link speed, the Link Rate tool can help you assess the efficiency of your TCP tuning or Window Size. In TCP/IP, the Window Size refers to how much data can be in flight before an acknowledgement must be received. You can see the TCP send and receive window size in the Connection List window (typically 32K). The "bandwidth-delay product" gives the recommended lower bound, while the "one second window size" gives the recommended upper bound.
For a given bandwidth (data rate) and delay (round trip time), the bandwidth-delay product (byte-rate * round-trip-time) tells you the minimum amount of data that must be in flight to keep the pipe full. If your send or receive window is less than the bandwidth-delay product, you are not allowing enough data in flight to utilize the full capacity of your connection.
For slower connections such as analog dial-up, it is possible for the receive window (amount of data in flight) to be too large. Consider a file transfer that allows several seconds worth of data to be in flight waiting to pass through a 33.3K modem connection. The sender normally waits about 1.5 seconds for a segment of data to be acknowledged before trying to send it again (the retransmit timeout interval). With a several second backlog waiting to get through the modem, the sender will begin retransmitting data that hasn't even reached the receiver yet, wasting precious bandwidth. The "One Second Window Size" shows the recommended maximum amount of data to allow in flight for slower data links.
If your TCP window size is too small (less than the Bandwidth-Delay Product), or too large (greater than the One Second Window Size), it simply means your network is operating at reduced efficiency. You can use IPNetTunerX (or similar network tuning utility) to improve your network performance by adjusting "net.inet.tcp.recvspace" to fall between the Bandwidth-Delay product (lower bound) and the One Second Window Size (upper bound).
You can select "Verbose Logging" to record more information about each ping that is sent.
You can have log information saved to a file.
You can automatically repeat a test at one minute intervals to record available bandwidth over time. You might use this to check for congestion or how well your ISP is delivering a promised service level.
When you invoke one window from another, the corresponding data is automatically transferred.
A popup menu keeps a list of Recent Targets or history. The contents of the target field are added to the list when a test to that target is invoked. If the recent targets menu becomes full (10 entries), the least recently used item will be removed. To add or remove an item, or clear the entire list, use the corresponding selections from the History menu.
IPNetMonitorX recognizes the 'GURL' AppleEvent to handle URLs of the form:
	linkrate://192.168.0.1
	linkrate://www.sustworks.com
You can select File->Save to save a double-clickable ".ipnm" document with the corresponding URL. You can preview the URL that will be saved by pausing over the "Save" button in the panel that appears. URLs are saved as plain text. You can include multiple URLs in the same file, one per line, to open the corresponding tools.
You can open and use multiple Link Rate windows at the same time.