The Monitor window allows you to see the characters per second throughput of your Internet connection in real time. Green bars in the upper half show receive data while red bars in the lower half show transmit. The plot shifts left each second to show the last minute of data transfer.
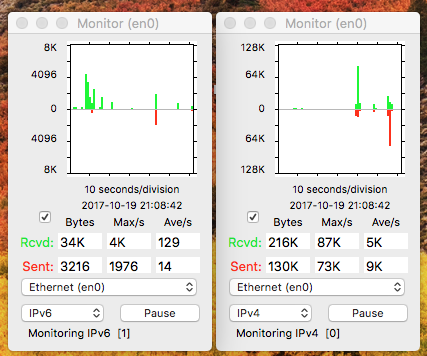
The scale for the vertical axis defaults to base-2 logarithmic and adjusts automatically so the data will fit. Each succesive vertical increment represents twice as much data. The marks on the vertical axis are spaced two increments apart corresponding to four times as much data (0, 2, 8, 32, 128, 512, 2K, 8K, 32K...). By using a logarithmic scale, small packets are easily visible along side large data transfers.
A check box by the bottom left of the plot area selects a linear vertical scale for visually comparing the relative size of plot segments.
The numeric display below the plot area shows the total number bytes sent and received as well as the maximum and average number of bytes per second. The total number of bytes sent and received is updated any time the Monitor window is running and is remembered between monitoring sessions. You can reset the totals by selecting "Clear" under the History menu. The average number of bytes per second is calculated over the last 10 seconds.
The popup menu just above the Start/Pause button selects the network port for monitoring. Notice you can have more than one Monitor window monitoring different network ports at the same time.
The popup menu just left of the Start/Pause button (v2.6.9 or newer) selects whether to monitor all traffic on this interface, IPv4 only, or IPv6 only. Notice you can have two Monitor probes per interface ([0] and [1]). Monitor windows attached to the same monitor probe will always receive the same data. To select the other probe, pause and then restart that monitor window.
IPNetMonitorX recognizes the 'GURL' AppleEvent to handle URLs of the form:
monitor://localhost;interface=en0
You can select File->Save to save a double-clickable ".ipnm" document with the corresponding URL. You can preview the URL that will be saved by pausing over the "Save" button in the panel that appears. URLs are saved as plain text. You can include multiple URLs in the same file, one per line, to open the corresponding tools.
The number of characters per second are counted at "network interrupt time" (splnet), so are largely unaffected by other applications on your system. The Monitor actually collects data by inserting a probe module (IPNetMonitor_NKE) between the network layer (IP) and the Data Link provider. The probe can be inserted as a DLIL Interface Filter (default) to see all traffic on that interface (including ARP), or as a DLIL Protocol Filter to see only IPv4 or IPv6 traffic.
The probe module (IPNetMonitor_NKE) only intercepts network traffic while monitoring is in progress. When the Monitor tool(s) for a given interface stop monitoring, the probe module is automatically removed from the corresponding data stream. The NKE normally remains loaded until you restart your system since other applications might be using it. You can try forcing the NKE to unload by selecting "Unload NKE" from the IPNetMonitorX application menu. This feature allows you to load a newer version of the NKE without restarting your system. The NKE will only unload when all monitoring connections to it have been stopped.
TroubleShootingThe bottom of the Monitor window below the Start/Pause button displays status messages. In order for the Monitor tool to function, it needs to load its NKE (Network Kernel Extension) and connect to it through a network socket. Starting in MacOS X High Sierra, NKEs will not be loaded unless they are explicitly authorized by the user in "System Preferences > Security & Privacy". When software like IPNetMonitorX tries to load an NKE for the first time, the NKE will fail to load and new options to authorize the requested NKE will appear in the Security & Privacy Preferences Pane for 30 minutes. See User-Approved Kernel Extension Loading.
If the NKE fails to load for any reason, IPNetMonitorX will alert you that it must be authorized in system preferences and provide a button to open the needed Preference Pane. Once the NKE has been authorized, it should not be necessary to repeat this step unless the signing ID of the NKE changes. If the NKE fails to load for any other reason, you may be prompted to authorize it, but all that is really needed is just to try again by restarting the Monitor tool.
In order for an NKE to load, the NKE itself must be owned by root, and not writable by any other user or group. The LoadNKE tool must also be run as root. The first run install process normally takes care of this configuration for you. If there is any doubt, you can remove the helper tools folder located at /Library/Application Support/IPNetMonitorX/Helper Tools/ so that IPNetMonitorX will recreate it the next time it is launched.
In order for IPNetMonitorX to connect with its NKE, IPNetMonitorX must be authorize to accept incoming network connections (as might be expected for a networking tool).