The TCP info window allows you to examine TCP/IP data transfer and connection behavior more closely.
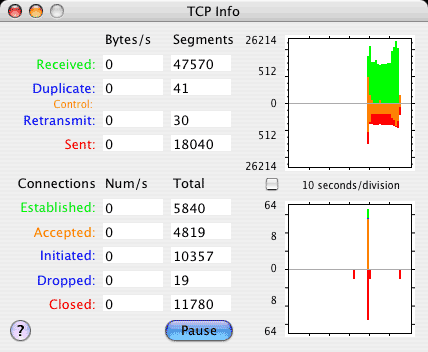
The plot on the upper right side of the window shows TCP Data transferred in bytes per second (no TCP or IP headers, and no UDP or ICMP datagrams). Green bars in the upper half show receive data while red bars in the lower half show transmit data if any. Blue bars indicate duplicate or retransmit data. The plot shifts left each second to show the last minute of data transfer.
Orange bars show the number of TCP control packets that do not contain any data such as SYN, ACK, FIN, keep alive or probe. Typically these packet consist of a 20-byte TCP header (and 20 byte IP header), but only the number of such packets is plotted, not their size.
The scale for the vertical axis defaults to base-2 logarithmic and adjusts automatically so the data will fit. Each succesive vertical increment represents twice as much data. The marks on the vertical axis are spaced two increments apart corresponding to four times as much data (0, 2, 8, 32, 128, 512, 2K, 8K, 32K...). By using a logarithmic scale, small duplicate or retransmit segments are easily visible along side large data transfers. The shorter segment is overlayed on top of the longer one making it easy to see even minor network inefficiency.
A check box by the bottom left of the plot area selects a linear vertical scale for visually comparing the relative size of plot segments.
The plot on the lower right side of the window shows TCP Connections per second. Green bars in the upper half show connections established while red bars in the lower half show connections closed. Orange or Blue bars in the upper half show connections accepted or initiated, while Blue bars in the lower half show connections dropped or aborted. The plot shifts left each second to show the last minute of connection behavior.
The window also includes counters that report the following: