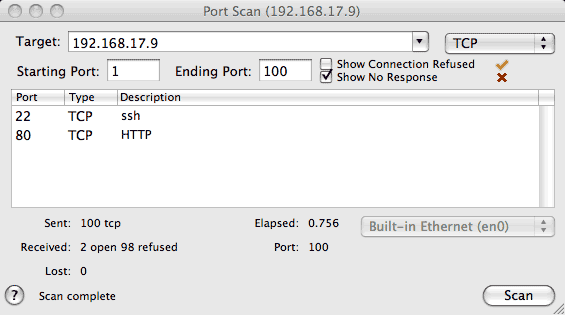
The Port Scan window allows you to scan a range of protocol ports to check for available services (listeners). This is especially useful for testing network security including firewalls by verifying that there are no unintended services available.
Enter the IP Address (or address range) of the host(s) you wish to scan along with the starting and ending port numbers in the corresponding fields and press Scan to begin scanning. If you have access to a Domain Name Server (DNS), you can type a DNS host name like "www.myhost.com" (or IP address) in the target field and press Return. If you leave the Ending Port empty, only the Starting Port number will be scanned. You can also specify a port range in the target field using the form address:start-end.
A popup menu to the right of the target field allows you to select the scan type. You can scan for TCP services, UDP services, or both.
Notice that port scanning can be used both to check the security of your own network, and to probe for weaknesses in remote networks. Some hosts or routers may interpret port scanning as a hostile attack and cut-off subsequent service. The rate of port scanning is adjusted based on the observed round trip time to avoid flooding network buffers.
Scan type TCP scans for TCP listeners by trying to open a normal TCP connection to each port and waiting 2 seconds to see if the connection is accepted or cancelled (Reset) by the remote peer. Since the connection request must wait for the target to respond, up to 20 parallel connections may be opened at the same time to improve scanning performance.
Notice there are three possible outcomes for each TCP probe:
If you select "Show Connection Refused" and the connection is refused an orange check is displayed. If you select "Show No Response" and the connection request times out after other responses have been received, a red "X" is displayed indicating that the port appears to be operating in "stealth" mode since there was no response. These options may be useful for firewall testing since connection refused versus no response may be meaningful in context. For example, the list of which ports are not blocked by a firewall would correspond to Connection Accepted or Connection Refused (blocked ports would not respond).
UDP ports are scanned by sending a UDP datagram to each port and checking for an ICMP destination unreachable response. Since detecting a UDP listener depends on not seeing an ICMP response from the target host, spurious ports may appear if the path to the remote host is unreliable. Scan type UDP retries any ports that fail to respond twice to minimize false positives. You can use the status headings in the lower left corner of the window to verify how many responses have actually been received.
Notice there are two possible outcomes for each UDP probe:
Scan type TCP above tries to open a normal TCP connection using "connect()". From a security testing standpoint, this has two limitations: (1) It only looks for ports that are listening for a TCP connection; (2) It is easily detected and logged by most firewalls and servers.
It is often possible to elicit a TCP stack response indicating an active port without trying to connect to an exposed server. The following techniques may be used:
When stealth scanning, the Port Scan tool must manually build the IP header including source IP address. Normally it uses the IP address of the first IP interface specified in your Network Preferences, but you can override this with the interface popup menu.
When you invoke one window from another, the corresponding data is automatically transferred.
A popup menu keeps a list of Recent Targets or history. The contents of the target field are added to the list when a test to that target is invoked. If the recent targets menu becomes full (10 entries), the least recently used item will be removed. To add or remove an item, or clear the entire list, use the corresponding selections from the History menu.
You can enter a range of addresses to port scan as 192.168.0.1-192.168.0.3 or 192.168.0.1-3 .
You can select the results of a Port Scan and copy them to the clipboard as plain text (for pasting into email messages). If you include the first row of the table in your selection, the table headings will also be copied.
IPNetMonitorX recognizes the 'GURL' AppleEvent to handle URLs of the form:
portscan://192.168.0.1:1-200;scanType=any;interface=en0
You can select File->Save to save a double-clickable ".ipnm" document with the corresponding URL. You can preview the URL that will be saved by pausing over the "Save" button in the panel that appears. URLs are saved as plain text. You can include multiple URLs in the same file, one per line, to open the corresponding tools.
You can open and use multiple Port Scan windows at the same time.